Research article · Descriptive population genetics
Abstract
Background. Cabo Verde's islands have distinct settlement and migration histories. Combining island samples can obscure differences in Y-chromosome lineage composition and give disproportionate influence to more heavily sampled islands.
Methods. Buccal-swab samples were collected between March 2023 and February 2025 from adult male participants of Cape Verdean paternal ancestry and analysed using Y-STR profiling and targeted Y-SNP testing. Participants were grouped by the reported birthplace of their paternal grandfather. Following ancestry and quality-control exclusions, the analytical sample comprised 1,257 individuals representing nine paternal-island groups. Pooled haplogroup frequencies were compared with an explicitly specified island-weighting scenario.
Results. E1b1a was the largest reported category (465/1,257; 36.99%), followed by R1b (318/1,257; 25.30%) and E1b1b (184/1,257; 14.64%). The combined A1a, E1a, E1b1a, and E2b categories accounted for 666/1,257 assignments (52.98%). Their combined frequency ranged from 14.02% on Fogo to 88.49% on Santiago; Maio was 75.00%. Applying the specified weights increased this combined frequency to 63.89%, a rise of 10.91 percentage points.
Conclusions. Island allocation materially influenced the combined frequencies. Reporting island-specific results alongside pooled and explicitly weighted summaries makes this compositional effect visible and supports more precise comparisons between datasets.
Keywords: Cabo Verde; Y chromosome; haplogroup; island variation; population weighting
1. Introduction
Cabo Verde's history includes the forced movement of enslaved Africans, European colonisation, Atlantic commerce, and migration between islands. These processes did not affect every island in the same way. Genetic studies have consequently examined both the archipelago's shared history and differences among its island populations (Gonçalves et al., 2003; Beleza et al., 2012; Laurent et al., 2023).
For the Badiu Heritage Project, this island-level perspective matters: a single archipelago-wide percentage can conceal Santiago's particular lineage composition. It is also important to distinguish the people represented in a dataset from the population to which an estimate is intended to apply.
Y-chromosome haplogroups describe branches within a hierarchical phylogeny of the non-recombining region of the Y chromosome. They provide a lineage-specific perspective on population history, distinct from genome-wide ancestry estimates (Y Chromosome Consortium, 2002; Beleza et al., 2012).
The objective of this study was to describe island-level variation in the supplied haplogroup counts and quantify the change in combined frequencies produced by a specified set of island weights.
2. Materials and methods
2.1 Participants, sample collection, and island assignment
Samples were collected between March 2023 and February 2025 from adult male participants of Cape Verdean paternal ancestry. Participants were assigned to an island according to the reported birthplace of their paternal grandfather. Cases with uncertain paternal-island origin were excluded from island-specific analyses. Island categories therefore represent reported paternal geographic origin, rather than the participant's birthplace, current residence, or sample-collection location.
Buccal-swab samples were obtained using sterile collection kits and processed for Y-chromosome analysis as described below.
Known close paternal relatives and duplicate records were excluded during quality control. Additional exclusions covered incomplete ancestry information, failed genotyping, and other predefined quality-control criteria. The final analytical sample comprised 1,257 individuals across nine island categories. Each participant was included once and assigned to a single paternal-island category.
The frequency analysis used the resulting aggregate haplogroup counts. Island totals and category totals were checked for arithmetic consistency. Earlier publications provided comparative context rather than the source of these counts.
2.2 Y-chromosome genotyping and quality control
Y-STR haplotypes were generated with the Applied Biosystems Yfiler Plus PCR Amplification Kit (Thermo Fisher Scientific). The kit amplifies 27 Y-STR markers, including the two-copy systems DYS385a/b and DYF387S1a/b (Thermo Fisher Scientific, Yfiler Plus user guide). The marker set comprised DYS576, DYS389I, DYS635, DYS389II, DYS627, DYS460, DYS458, DYS19, Y-GATA-H4, DYS448, DYS391, DYS456, DYS390, DYS438, DYS392, DYS518, DYS570, DYS437, DYS385a/b, DYS449, DYS393, DYS439, DYS481, DYF387S1a/b, and DYS533.
Y-STR profiles were used for preliminary lineage assessment and quality control. Final haplogroup assignments were based on targeted Y-SNP genotyping. The hierarchical panel included M31 for A-lineage resolution; M33, M132, M2, M35, M215, M78, M81, M123, M75, M54, M85, and M98 for E-lineage resolution; M201, P15, and L30 for G; M170, P37.2, and M423 for I-lineage resolution; M304, M267, and M172 for J; M207, M343, and M269 for R-lineage resolution; and M70 for T. Downstream markers were tested after confirmation of the corresponding upstream branch. This list describes assay targets, not positive findings for every listed marker.
Targeted Y-SNP genotyping was performed with custom multiplex assays based on the Applied Biosystems SNaPshot Multiplex Kit (Thermo Fisher Scientific). SNP loci were arranged into hierarchical multiplexes according to their phylogenetic positions. Following locus-specific PCR amplification, alleles were determined by single-base primer extension. Extension products were separated by capillary electrophoresis on an Applied Biosystems 3500 Genetic Analyzer, and genotypes were reviewed using GeneMapper Software. Ambiguous calls were repeated before haplogroup assignment. The manufacturer's documentation describes the single-base-extension workflow, compatibility with 3500-series instruments, and GeneMapper analysis (Thermo Fisher Scientific, SNaPshot Multiplex Kit).
Haplogroups were assigned using the International Society of Genetic Genealogy Y-DNA Haplogroup Tree, version 15.73, dated 11 July 2020 (ISOGG, 2020). Classification proceeded from upstream defining SNPs to the most downstream informative marker tested in each sample. For population-level analysis, SNP-defined assignments were consolidated into the ten study reporting categories: A1a, E1a, E1b1a, E1b1b, E2b, R1b, I2a, G2a, J, and T. The defining SNP result and the study reporting label were retained together in the analysis file. Frequencies are reported at this grouped level rather than for every SNP-defined branch tested.
Profiles were accepted when they met predefined peak-height, allele-balance, and completeness criteria. Incomplete or ambiguous profiles were repeated, and specimens that continued to fail quality-control requirements were excluded. Positive and negative controls were included in each amplification batch. Concordance between the preliminary Y-STR lineage assessment and targeted Y-SNP results was reviewed before final assignment; where they differed, the SNP-defined lineage determined the final classification.
2.3 Pooled frequencies and the weighting scenario
For each island, a category's frequency is its count divided by the island total. The pooled frequency is the sum of its counts divided by 1,257. This describes the supplied dataset, not automatically the national population.
For each category, the weighted frequency was calculated as pᵥ = Σ(wᵢ × pᵢ), where pᵢ = xᵢ / nᵢ, xᵢ is the category count, nᵢ is the island sample size, and wᵢ is the specified island weight. The weights sum to 1. The pooled frequency is the special case in which wᵢ = nᵢ / 1,257.
Table 1. Sample sizes by paternal grandfather's island of birth and weights used in the scenario analysis.
| Island | Reported assignments | Scenario weight |
|---|---|---|
| Santiago | 417 | 0.571 |
| São Vicente | 199 | 0.156 |
| Santo Antão | 103 | 0.070 |
| Fogo | 107 | 0.064 |
| Sal | 111 | 0.064 |
| Boa Vista | 82 | 0.030 |
| São Nicolau | 89 | 0.022 |
| Maio | 76 | 0.013 |
| Brava | 73 | 0.010 |
| Total | 1,257 | 1.000 |
The weights in Table 1 define the analytical scenario. Their demographic source and reference population remain unspecified, so they are not treated as census weights. Because groups are defined by paternal grandfather's birthplace, present-day island residence totals are not interchangeable with the population distribution of these ancestral-island categories. Population calibration requires appropriate benchmarks and assumptions linking the sample to the target population (Chen et al., 2018).
Calculations used unrounded frequencies, with percentages and percentage-point differences rounded to two decimal places for presentation. Analyses were descriptive; confidence intervals and significance tests were not calculated. Exclusion of known close paternal relatives reduced one potential source of dependence, but population inference would additionally require the recruitment design and a suitable sampling model.
2.4 Combined categories and geographic interpretation
Individual haplogroup frequencies were the primary outcomes. A1a + E1a + E1b1a + E2b was also evaluated as a combined analytical category. Additional grouped totals were reported by their constituent haplogroups. These combinations describe the distribution of assignments rather than continental ancestry proportions.
Geographic interpretation depends on branch resolution and comparative populations. For example, the identification of R-V88 in African populations demonstrates why broad R1b assignments cannot uniformly be equated with European ancestry (Cruciani et al., 2010). This example concerns interpretation of the classification, not an R-V88 finding in the present dataset.
3. Results
3.1 Reported island-level haplogroup counts
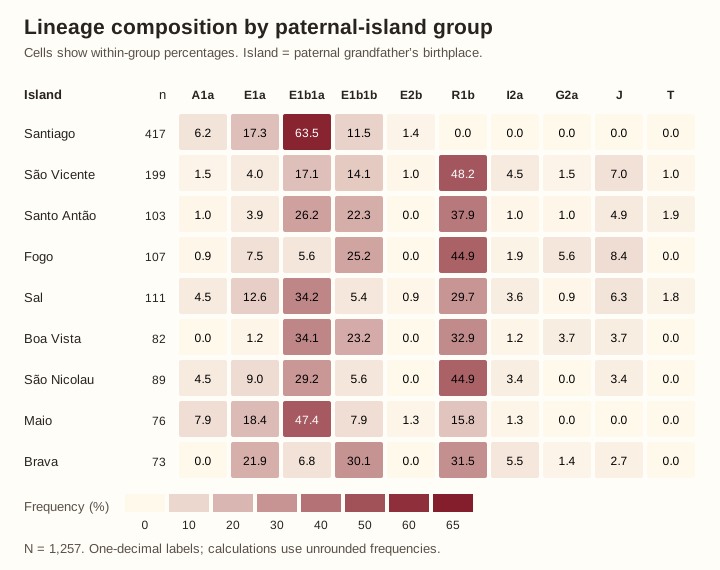
The dataset comprised 1,257 assignments, with paternal-island group sizes ranging from 73 for Brava to 417 for Santiago.
Table 2. Y-chromosome haplogroup counts by reported birthplace of the paternal grandfather.
| Island | n | A1a | E1a | E1b1a | E1b1b | E2b | R1b | I2a | G2a | J | T |
|---|---|---|---|---|---|---|---|---|---|---|---|
| Santiago | 417 | 26 | 72 | 265 | 48 | 6 | 0 | 0 | 0 | 0 | 0 |
| São Vicente | 199 | 3 | 8 | 34 | 28 | 2 | 96 | 9 | 3 | 14 | 2 |
| Santo Antão | 103 | 1 | 4 | 27 | 23 | 0 | 39 | 1 | 1 | 5 | 2 |
| Fogo | 107 | 1 | 8 | 6 | 27 | 0 | 48 | 2 | 6 | 9 | 0 |
| Sal | 111 | 5 | 14 | 38 | 6 | 1 | 33 | 4 | 1 | 7 | 2 |
| Boa Vista | 82 | 0 | 1 | 28 | 19 | 0 | 27 | 1 | 3 | 3 | 0 |
| São Nicolau | 89 | 4 | 8 | 26 | 5 | 0 | 40 | 3 | 0 | 3 | 0 |
| Maio | 76 | 6 | 14 | 36 | 6 | 1 | 12 | 1 | 0 | 0 | 0 |
| Brava | 73 | 0 | 16 | 5 | 22 | 0 | 23 | 4 | 1 | 2 | 0 |
| Total | 1,257 | 46 | 145 | 465 | 184 | 10 | 318 | 25 | 15 | 43 | 6 |
3.2 Haplogroup composition
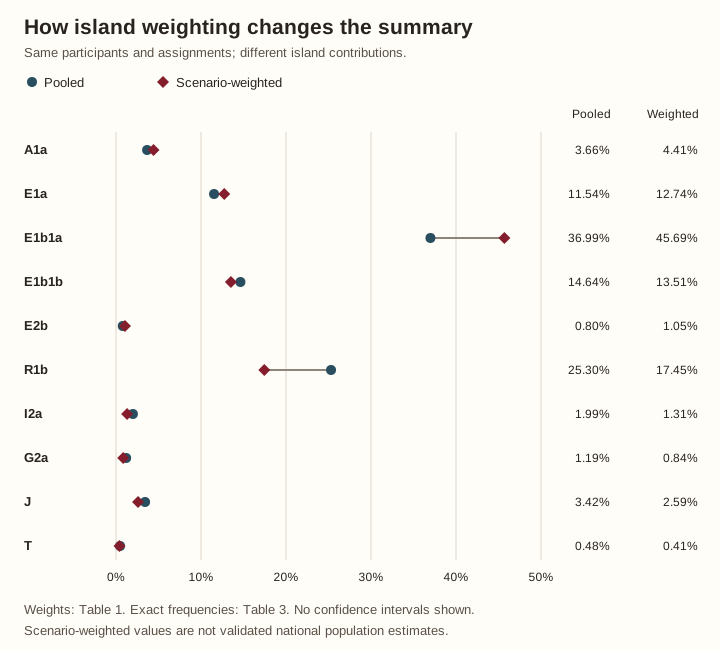
E1b1a is the largest pooled category at 36.99%. Under the specified weighting scenario, its frequency increases to 45.69%. R1b changes from 25.30% to 17.45%, while E1b1b changes from 14.64% to 13.51%.
Table 3. Pooled and scenario-weighted haplogroup frequencies.
| Reported haplogroup | Count | Pooled % | Scenario-weighted % |
|---|---|---|---|
| A1a | 46 | 3.66 | 4.41 |
| E1a | 145 | 11.54 | 12.74 |
| E1b1a | 465 | 36.99 | 45.69 |
| E1b1b | 184 | 14.64 | 13.51 |
| E2b | 10 | 0.80 | 1.05 |
| R1b | 318 | 25.30 | 17.45 |
| I2a | 25 | 1.99 | 1.31 |
| G2a | 15 | 1.19 | 0.84 |
| J | 43 | 3.42 | 2.59 |
| T | 6 | 0.48 | 0.41 |
Percentages may not sum to exactly 100% after rounding.
3.3 Island variation in the combined category
The combined A1a + E1a + E1b1a + E2b count is 666. Its frequency is highest on Santiago and lowest on Fogo.
Table 4. Island frequencies of the combined A1a + E1a + E1b1a + E2b category.
| Island | Combined count | Island total | Combined % |
|---|---|---|---|
| Santiago | 369 | 417 | 88.49 |
| São Vicente | 47 | 199 | 23.62 |
| Santo Antão | 32 | 103 | 31.07 |
| Fogo | 15 | 107 | 14.02 |
| Sal | 58 | 111 | 52.25 |
| Boa Vista | 29 | 82 | 35.37 |
| São Nicolau | 38 | 89 | 42.70 |
| Maio | 57 | 76 | 75.00 |
| Brava | 21 | 73 | 28.77 |
3.4 Effect of island weighting
Santiago contributes 33.17% of the assignments but receives 57.10% of the scenario weight. Because the combined category is especially frequent there, the weighted result is higher. This reflects changing island contributions, not discovering additional lineages or changing anyone's classification.
Table 5. Changes in grouped frequencies under the island-weighting scenario.
| Categories combined | Pooled count | Pooled % | Scenario-weighted % | Difference (percentage points) |
|---|---|---|---|---|
| A1a + E1a + E1b1a + E2b | 666 | 52.98 | 63.89 | +10.91 |
| E1b1b | 184 | 14.64 | 13.51 | −1.12 |
| R1b + I2a + G2a | 358 | 28.48 | 19.60 | −8.88 |
| J + T | 49 | 3.90 | 3.00 | −0.90 |
| All reported A and E categories (subtotal) | 850 | 67.62 | 77.41 | +9.78 |
The subtotal overlaps the first two rows and must not be added to the other rows. Differences are calculated from unrounded values, so subtracting displayed rounded percentages may give a slightly different result.
4. Discussion
4.1 Island composition and comparison with previous studies
Changing the relative contribution of islands changes the combined frequencies. Here, the specified weights give greater influence to Santiago and increase the combined A1a, E1a, E1b1a, and E2b frequency by 10.91 percentage points.
The distinction between pooled and weighted frequencies is compositional: the same island-level values are combined using different weights. Population inference additionally depends on suitable benchmarks and a defensible model of sample selection, as established in research on calibration of non-probability samples (Chen et al., 2018). Here, interpretation is restricted to the supplied aggregate dataset and specified weights.
Beleza et al. (2012) reported E1b1a at 18.8% and R1b1b2 at 42.7% among 431 men from six islands. The present table reports E1b1a at 36.99% and the broader R1b category at 25.30%. These are descriptive comparisons, not directly matched estimates: island coverage, allocation, and category resolution differ.
The difference already exists in the unweighted figures, so weighting cannot explain it on its own. The present study groups participants by paternal grandfather's birthplace. Comparisons with samples classified by participant birthplace or residence require harmonisation of the island-assignment rule as well as haplogroup definitions, recruitment, collection dates, and treatment of relatives. These are factors to investigate, not demonstrated causes of the difference.
The island-specific approach is also consistent with the distinct admixture histories examined by Laurent et al. (2023), although their genomic and linguistic analyses address different outcomes from the haplogroup frequencies reported here.
4.2 Lineages, history, and Badiu heritage
The non-recombining Y-chromosome phylogeny traces a direct paternal lineage (Y Chromosome Consortium, 2002). In Cabo Verde, analyses of Y-chromosomal, autosomal, and X-chromosomal markers have yielded distinct perspectives on population history and sex-biased admixture (Beleza et al., 2012). These different inheritance systems should therefore be interpreted as complementary, rather than interchangeable, descriptions of ancestry.
For Badiu heritage, the value here is the attention to Santiago and to variation concealed by a single archipelago-wide average. More detailed genetic classifications, family histories, and historical records could help connect particular lineages with that history. These aggregate counts do not yet establish those connections, and genetic categories do not determine who belongs to Badiu culture.
5. Conclusion
The supplied table contains 1,257 reported Y-chromosome assignments, with E1b1a as its largest category. A1a + E1a + E1b1a + E2b accounts for 52.98% of the pooled data and 63.89% under the specified weighting scenario. Santiago has the highest island-level frequency of this combined category, at 88.49%.
The 10.91-percentage-point difference demonstrates the sensitivity of an archipelago-wide summary to island allocation. Reporting the underlying counts, island frequencies, and weighting assumptions together provides a reproducible basis for interpreting this effect.
Data and reproducibility. Aggregate counts, category definitions, and scenario weights are provided above.
References
- Chen JKT, Valliant RL, Elliott MR (2018). Model-assisted calibration of non-probability sample survey data using adaptive LASSO. Survey Methodology 44(1): 117–144. Full text.
- Beleza S, Campos J, Lopes J, Araújo II, Hoppfer Almada A, Correia e Silva A, Parra EJ, Rocha J (2012). The Admixture Structure and Genetic Variation of the Archipelago of Cape Verde and Its Implications for Admixture Mapping Studies. PLoS ONE 7(11): e51103. Article.
- Cruciani F, Trombetta B, Sellitto D, et al. (2010). Human Y chromosome haplogroup R-V88: a paternal genetic record of early mid Holocene trans-Saharan connections and the spread of Chadic languages. European Journal of Human Genetics 18: 800–807. Article.
- Gonçalves R, Rosa A, Freitas A, Fernandes A, Kivisild T, Villems R, Brehm A (2003). Y-chromosome lineages in Cabo Verde Islands witness the diverse geographic origin of its first male settlers. Human Genetics 113(6): 467–472. Article.
- Laurent R, Szpiech ZA, da Costa SS, et al. (2023). A genetic and linguistic analysis of the admixture histories of the islands of Cabo Verde. eLife 12: e79827. Article.
- Y Chromosome Consortium (2002). A nomenclature system for the tree of human Y-chromosomal binary haplogroups. Genome Research 12(2): 339–348. Article.
- Thermo Fisher Scientific. Yfiler Plus PCR Amplification Kit User Guide. Publication MAN0030230. Manufacturer documentation for kit composition. User guide.
- Thermo Fisher Scientific. SNaPshot Multiplex Kit. Catalogue 4323163. Manufacturer documentation for single-base-extension genotyping and instrument/software compatibility. Product documentation.
- International Society of Genetic Genealogy (ISOGG) (2020). Y-DNA Haplogroup Tree, version 15.73, 11 July 2020. Version history.